

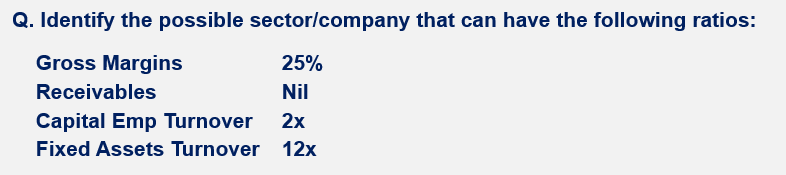
Let’s say you are present with a company X with the following ratios and you have to decipher the company:
Sounds challenging? Let’s deep dive into the basics of financial ratios to make this task interesting.
What are Financial Ratios Analysis?
It compares the line-item data from a company's financials to reveal insights regarding profitability, liquidity and operational efficiency. This analysis can be done between two similar competitors or to see how the company has performed over a period of time. For a better understanding let's take a hypothetical unit economics of setting up a retail store.
Aditya Vision is a leading electronic retailer in Bihar. Their business model is similar to Reliance Digital, but they focus more on Tier 2/3 cities like Patna & Gaya. To understand their business model, let’s look at the high-level sales and operating costs of one store:
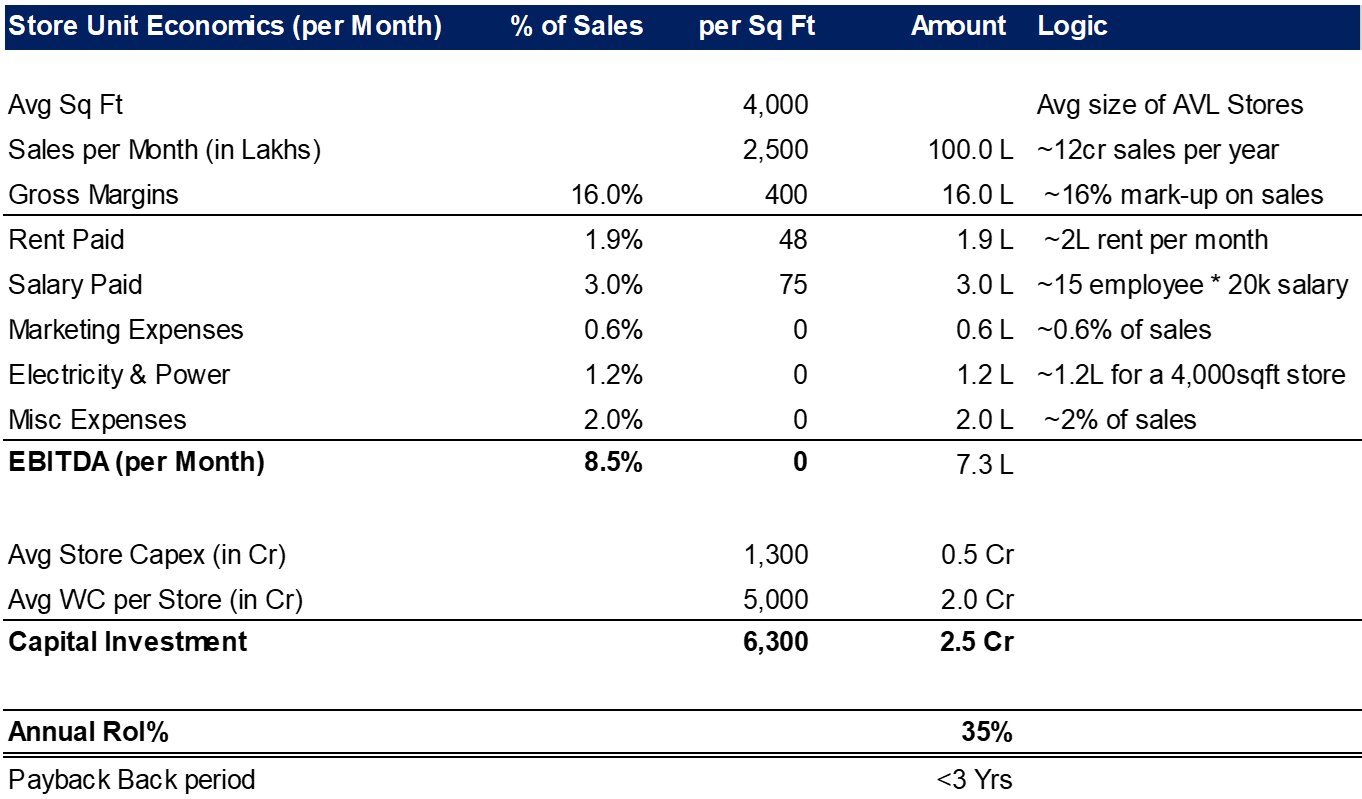
Here, as you might have noticed, we are trying to find the Return on Investment (RoI) of an individual store. This RoI broadly depends on three factors, (A) Amount of Capex (B) Sales generated from this capex, and (C) Operating Margins generated from the sales.
To explain these components using Aditya Vision’s stores, each store needs ~2.5 cr of initial investments, this in turn results in ~12cr of annual sales (i.e a Sales turnover of 4.8x). But of this 12 cr of sales, the company is left with an operating income of ~0.9cr (i.e an Operating margin of 8.5%).
Let’s understand each of these ratios separately:
(Note: There is no exact formula of these ratios, it differ from Industry to Industry, we have taken the generally accepted and most popular ratios)
Profitability Ratios
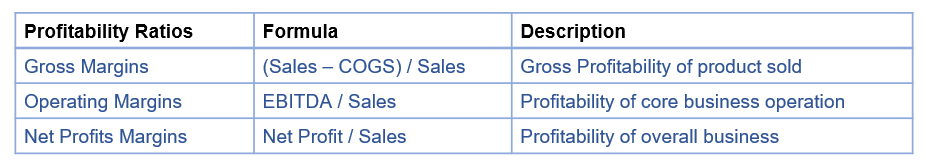
Gross Margins: Gross profit margin indicates the percentage of revenue available to cover operating and other expenditures. Higher gross profit margin (as compared to competitors) could be due to:
Higher product pricing: If a product has a competitive advantage (e.g., superior branding, better quality, or exclusive technology), the company is better able to charge more for it, which might lead to higher gross margins.
Lower Production Cost: Higher gross profit margin can be due to a competitive advantage in production.
Operating Margins: Operating margin is also a good measure of management’s efficiency. The reason for higher margins (as compared to competitors could be:
Scale benefits
Low-cost operating model
Technological advantage
Net Profit Margins: A company’s net profit margin tells you how much after-tax profit the business makes for every Rs 1 it generates in revenue or sales. A high-profit margin typically indicates that a company either has a highly proprietary good or service, possibly one that’s “branded” and therefore able to carry a price premium.
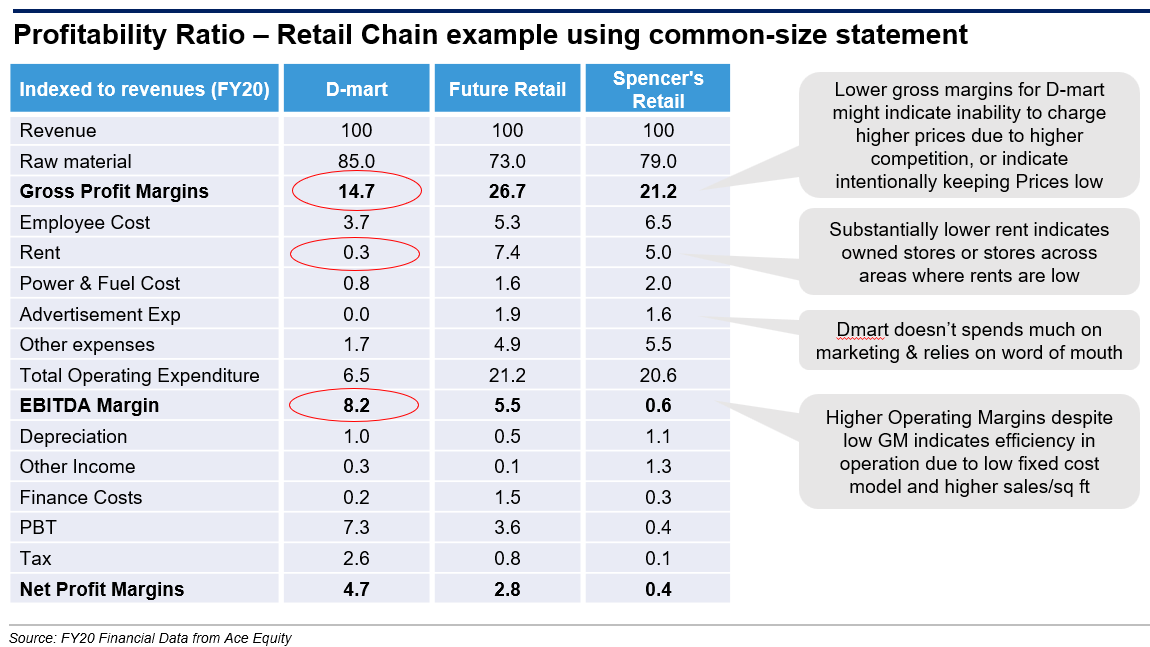
Let us understand the profitability ratios using common-size statements of grocery retailers and connect their business model with the ratio:
But are higher margins always good? While as a thumb rule, it is better to have higher margins, it is more important to have a higher RoE, which represents the profit generated on investments made by the owners. That’s why analyzing only the Profitability Ratio is not enough, we also need to look at the Turnover Ratio & Leverage Ratio.
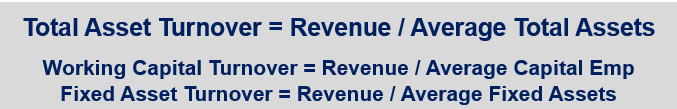
Turnover Ratios
Turnover ratios measure how efficiently the company utilizes assets, and its ability to convert different assets into cash or sales.
Working Capital Turnover Ratio:
The working capital turnover ratio measures how well a company is utilizing its working capital to support a given level of sales.
In Aditya Vision’s case, as they generate ~12cr of annual sales using ~2cr of Working Capital, the WC Turnover ratio is 6x. This basically means, the company can generate sales of 6 times the working capital it is holding.
We have discussed the various components of WC in detail in this article.
Fixed Assets Turnover Ratio:

It measures how efficiently the company generates revenues from its investments in fixed assets. Generally, a higher fixed asset turnover ratio indicates a more efficient use of fixed assets in generating revenue.
A low Ratio indicates, inefficiency, a capital-intensive business environment, or a new business not operating at full capacity
These ratios are higher for service-oriented businesses with lower fixed assets requirements
Note: We prefer taking Gross Fixed Assets (i.e before deducting depreciation) to compute this ratio, as Net Fixed Assets are distorted due to bookish deduction of depreciation and don't show a true picture of the assets.
Total Assets Turnover Ratio:
This ratio measures the company’s overall ability to generate revenues with a given level of assets. A ratio of 3.0 indicates that the company is generating Rs 300 of revenues for every Rs 100 of average assets.
Because this ratio includes both fixed and current assets, inefficient working capital management can distort overall interpretations. It is, therefore, helpful to analyze working capital and fixed asset turnover ratios separately (as Total Assets are roughly equal to Fixed Assets + Working Capital)
Many analysts make the mistake of comparing Turnover ratios across multiple sectors. Let’s understand the problem this analysis entails. The below table shows the Turnover ratios and Margins of multiple retailers. It clearly shows that Jewellery and electronics are high turnover sectors compared to Grocery and Apparel retailing, largely due to higher ticket sizes. But this lower turnover for grocery/apparel sectors is compensated by higher EBITDA margins in respective sectors.
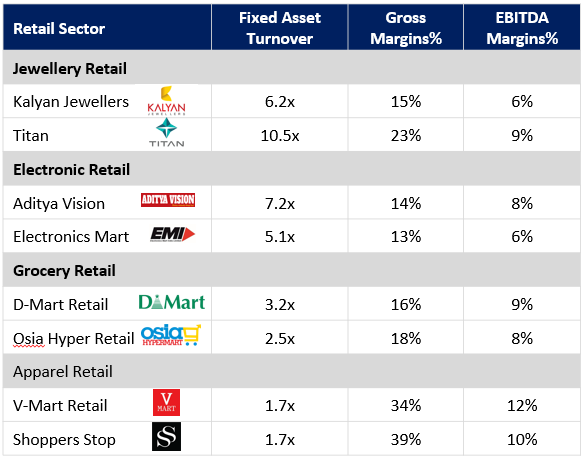
Note, one interesting trend in this table is that Titan clearly stands out because of its higher turnover ratio and relatively higher margins than other retailers. This translated to a higher RoE of 30%+ vs. the sector RoE of 15-20%.
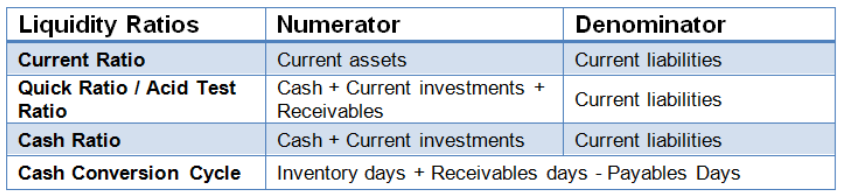
Liquidity Ratios
The liquidity ratio measures how quickly assets are converted into cash. It also showcases the company’s ability to pay off its short-term liabilities using current assets.
The current and quick ratios reflect two measures of a company’s ability to pay current liabilities. Each uses a progressively stricter definition of liquid assets.
Quick Ratio considers the quick assets i.e. assets that can be most quickly converted to cash (cash, marketable securities and receivables). The quick ratio reflects the fact that current assets like inventory might not be easily and quickly converted into cash, and furthermore, that a company would probably not be able to sell all of its inventory for an amount equal to its carrying value, especially if it were required to sell the inventory quickly.
A ratio lower than the industry average may indicate a higher risk of distress or default. Alternatively, a higher ratio may indicate that the management is not using its assets efficiently
Note: We generally calculate Liquidity Ratios for small companies or companies in distress. Larger listed companies generally have good credit ratings, and have relatively easier access to short-term debt financing, if needed.

Leverage Ratio
While Liquidity Ratios help measure a company’s ability to meet short-term obligations (how quickly assets are converted into cash), Leverage ratios help assess a company’s ability to fulfil its long-term capital obligations.
These ratios access the relative amount of debt in the company’s capital structure and the adequacy of earnings and cash flow to cover interest expenses and other fixed charges as they come due.
We have discussed about Leverage ratio in a separate article.
Shareholder Ratios
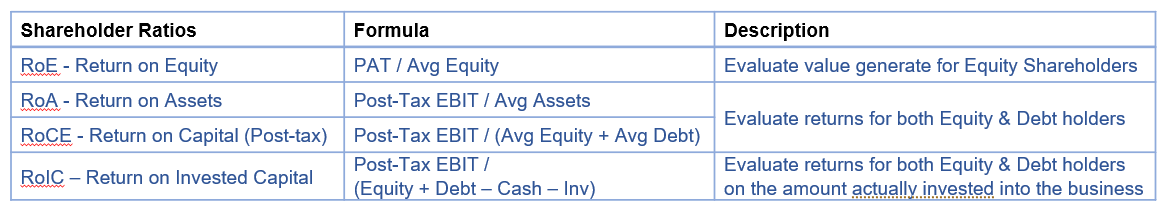
Return on Assets: Return on Assets or ROA measures the return earned by a company on its assets. The higher the ratio, the more income is generated by a given level of assets. We include interest while computing RoA because it is the return generated from all assets invested in the company whether financed with debt or equity.
Return on Capital Employed: Return on total capital measures the profits a company earns on all of the capital that it employs (short-term debt, long-term debt, and equity). It can be either computed on a pre-tax or post-tax basis
Return on Equity: A business that earns a high ROE is more likely to be one that is capable of generating cash internally and thus has less or no need for external capital (debt) to grow its operations. RoE is often compared to the average cost of capital as an aid in investment decision-making.
Return on Invested Capital: It shows how efficiently the company is using the funds provided by the investors to generate income for the business. RoIC is calculated on the basis of total Invested capital, which is the amount of capital that is circulating in the business while capital employed is the total capital it has. Invested capital is, therefore, a subset of capital employed.
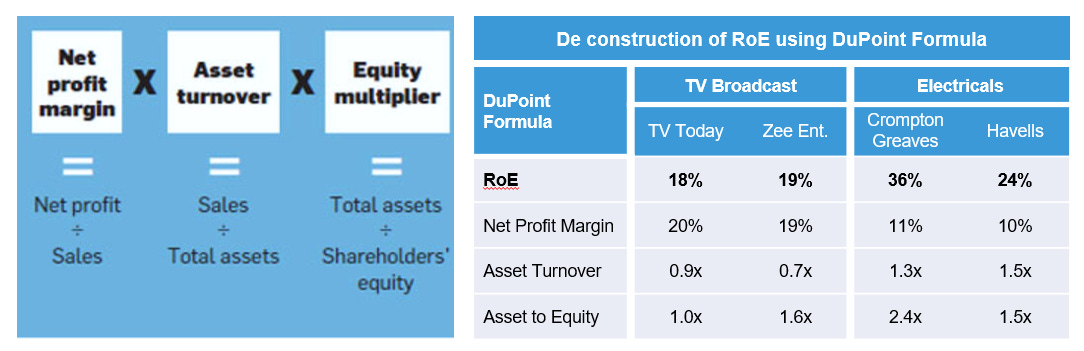
Breaking RoE using DuPoint Formula
Having a higher RoE may not be always a good thing: It is important to know where the higher RoE is coming from, thus we need to de-construct the RoEs using the DuPoint formula into three parts
The three-step DuPont model captures the efficacy of the company management to generate profits (net profit margin), utilize its assets (asset turnover) and deploy optimal leverage (equity multiplier).
While it is noteworthy that an increase in leverage has the potential to magnify the returns shareholders receive from their shares, ultimately financial leverage increases the risk for a company’s shareholders.
Higher RoEs of Zee and Crompton Greaves don’t give us comfort because their higher RoEs (compared to TV Today & Havells) are due to higher leverage taken on the balance sheet.
Combining all the Ratios…
Our thought process while solving this case will be:
Receivables: It can be Nil only if we receive upfront payment from customers. So, it’s a direct-to-customer kind of company (like the service sector, e-comm, retail, multiplex, airlines, hotels, Hospitals, QSR, etc.)
Fixed Asset T/o: It's 12x thus the sector is not capital intensive (or Assets/stores are on rent) - probably a service sector-related stock, but that can’t be the case as the Capital Employed T/o ratio is too low.
Capital Employed T/o: Comparing this with the Fixed Asset T/o ratio, we conclude that Net Working Capital could be on the higher side. Which means either Investors or Receivables are higher. As receivables are Nil, the sector has a higher inventory. It clearly can't be a service sector company (can be e-comm, retail, QSR). Most likely it's a retail company.
Gross margins: D-Mart & similar retail companies as they deal in low-margin products, GM can’t be 25%-30%. So probably it will be a fashion or luxury retail retailer, like Titan, V-mart, Trent, Shopper Stop etc.
Final Answer: Titan